Over the last year the Nature Positive Initiative has been engaging widely to build a global consensus on an aligned core set of State of Nature Metrics. The current draft metrics are the result of a wide consultation that ran in 2024 and will be further tested in 2025 through piloting.
Here we delve deeper into the four indicators outlined in the draft State of Nature Metrics that help measure and track the state of nature over time, to drive action that can lead to overall nature-positive outcomes at scale.
Indicators: A quantitative or qualitative factor or variable that provides a simple and reliable means to measure the state of nature. An indicator can be measured through one or multiple metrics
Metrics: A system or standard of measurement that is quantifiable and is used to track, compare, and assess indicator performance.
These definitions and examples are framed around companies and financial institutions who are offering to pilot-test the draft State of Nature Metrics. Once tested, the metrics can then be refined and prepared for use from 2026 onwards by a wide range of actors and use cases.
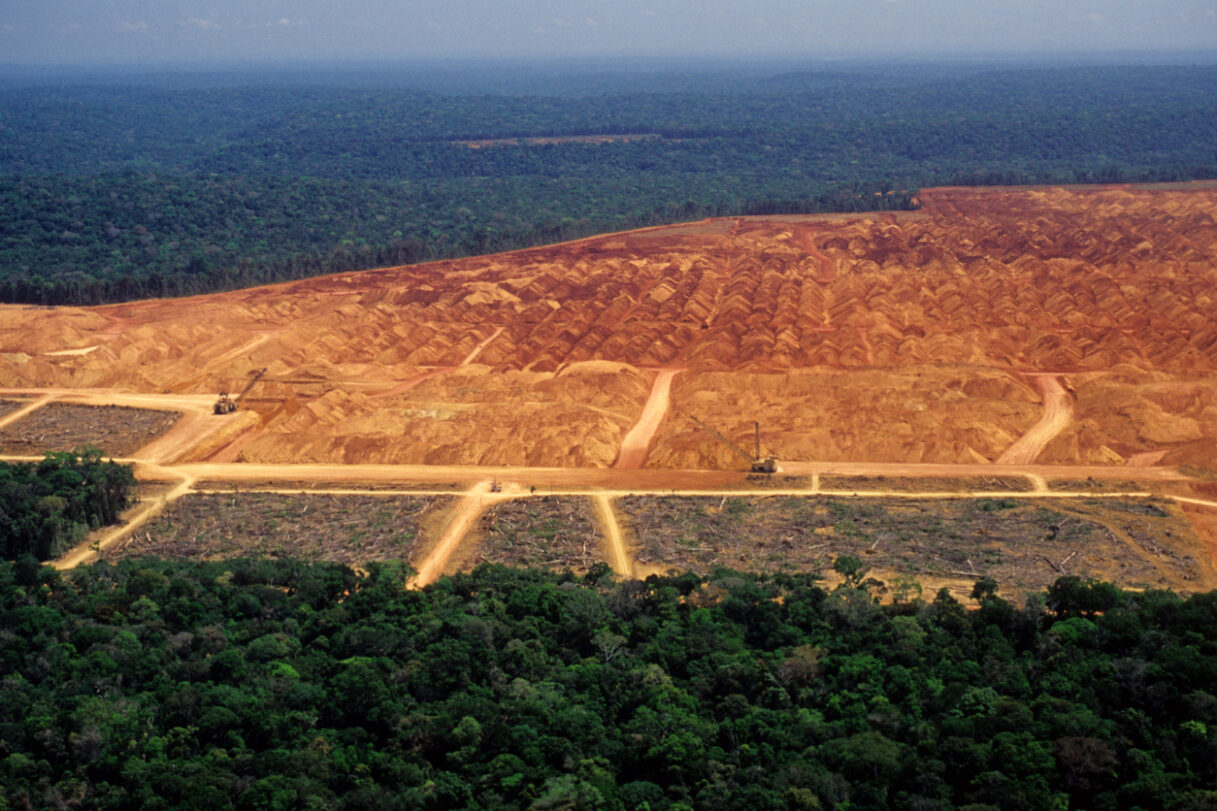
Ecosystem extent
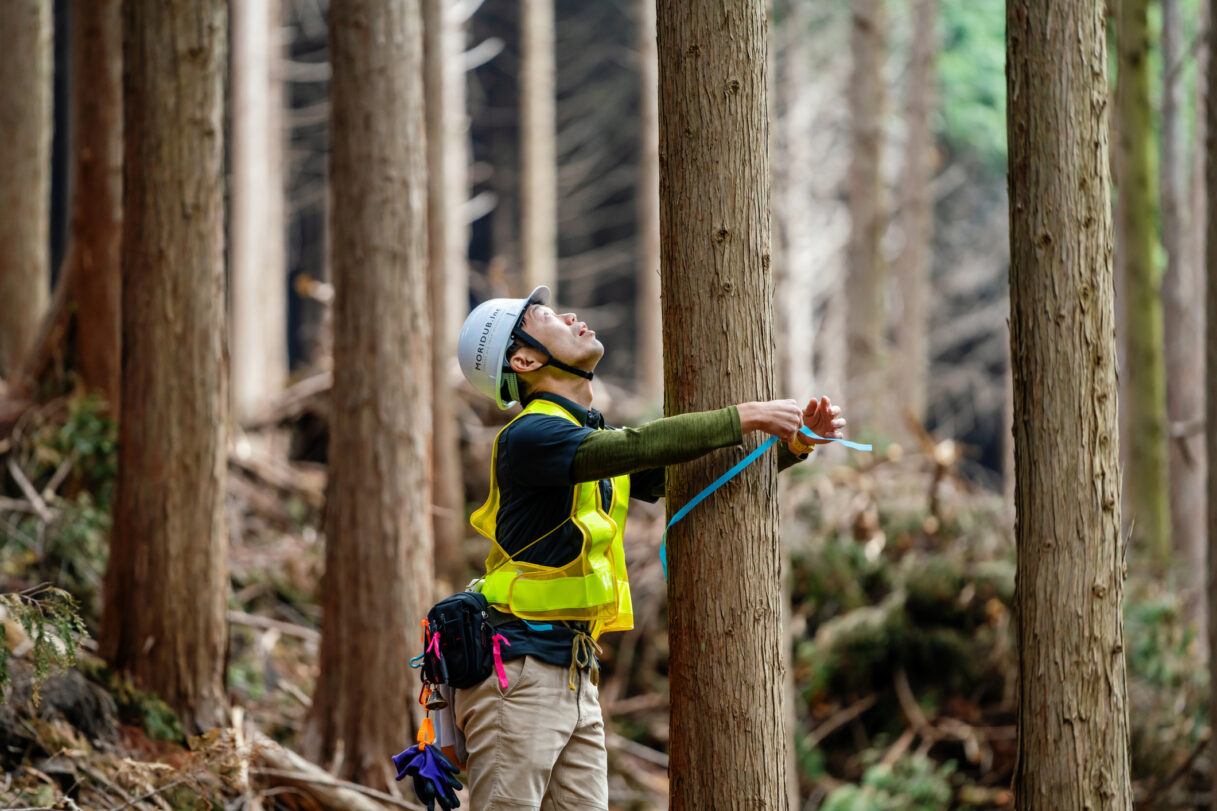
Ecosystem extent is the size and space of a particular natural habitat, over which the company has ownership or influence within its value chain (in the case of measuring state of nature). This includes the area of nature which is being used to provide resources and natural services.
For example, this indicator allows the area of different ecosystem types to be known, from the extent of tropical rainforest, temperate woodland, cool desert, or polar tundra that are used as part of the business, and how they’ve changed over time. Tracking ecosystem extent helps measure changes in habitat size, showing whether an ecosystem is expanding, shrinking, or shifting in type. This indicator helps understand trends in habitat loss or restoration.
Ecosystem condition
Once we know the ecosystem extent, we can look at the condition of the biodiversity within that ecosystem – the ecosystem condition.
Ecosystem condition is like human health. From the outside, a person might look fine but their internal health could tell a different story. If their heart isn’t functioning properly, their lungs are struggling, or their immune system is weak, they may not be truly healthy.
Similarly, an ecosystem may appear to be healthy in terms of size – trees are standing, water is flowing – but key functions like connectivity, pollination, or soil regeneration may be failing.
This measurement helps us answer how healthy the ecosystem in question is. Ecosystem condition is broken down by site and landscape scales:
Ecosystem condition (site condition)
Measuring the ecosystem condition of a site means looking at the specific place – such as where something is built or where something is being harvested or extracted. For example, the place where an agricultural company is sustainably harvesting a crop. It is important to assess ecosystem condition at site level because this is within the direct control of the user (for example the company, organization, business or other entity).
Assessing the value chain is also necessary and includes areas under the control of the user’s value chain partners, for example, a manufacturer of paper products would consider the forests managed by its suppliers. If the place, or places, in question spread across the supply chain, this means that the user must assess the ecosystem condition throughout. This helps us understand the health of nature of the site.
Ecosystem condition complements ecosystem extent as it gives a more whole picture of what’s happening in that ecosystem. Site condition helps determine whether the ecosystem can function and provide the ecosystem services such as climate regulation and freshwater provision, that are required on an ongoing basis (i.e. not for a finite amount of time).
Much like the health example above, this means that an ecosystem – like a tropical rainforest – may have a dense canopy when looking from above, but beneath the surface, the area has removed key species for timber and pulp production, leaving the ecosystem struggling to support the diversity of species which rely on the trees for food and shelter, or larger services like climate regulation, soil health, and water filtration.
By adding condition indicators to extent, we better understand the health of nature at specific sites.
Ecosystem condition (landscape condition)
Measuring ecosystem condition at the landscape level allows us to step back from individual sites and see the forest for the trees, so to speak, to understand intactness (patches or fragments), structural connectivity (corridors between patches) and functional connectivity (movement between areas).
This provides valuable information about the ecosystem condition beyond a site boundary and into the larger picture of health across a diversity of land uses and actors, such as multiple businesses working in the same location to understand their broader impacts on nature.
Landscape condition is important to measure in addition to site condition because achieving and sustaining nature-positive outcomes at a particular site will depend on the health and condition of the surrounding landscape. It is also relevant as we do not operate in a vacuum, and activities often have outputs or consequences that affect the wider landscape. Therefore we must look at the health of the biodiversity in the larger area where the site is located in order to give an overall indication of the state of nature.
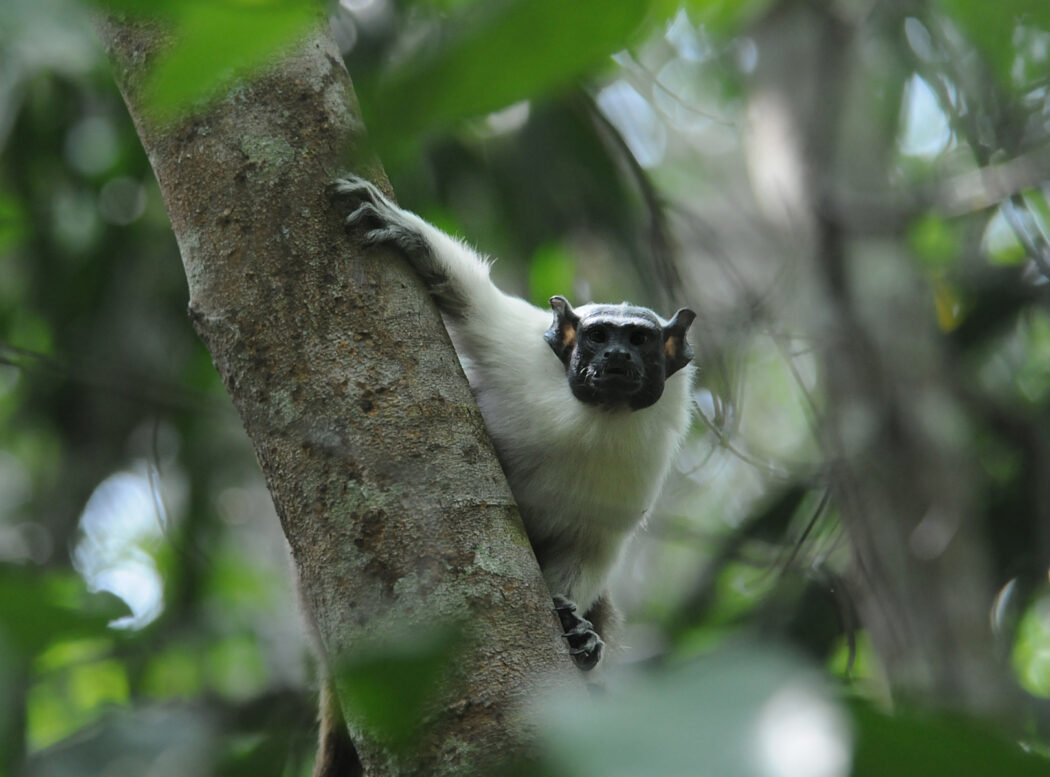
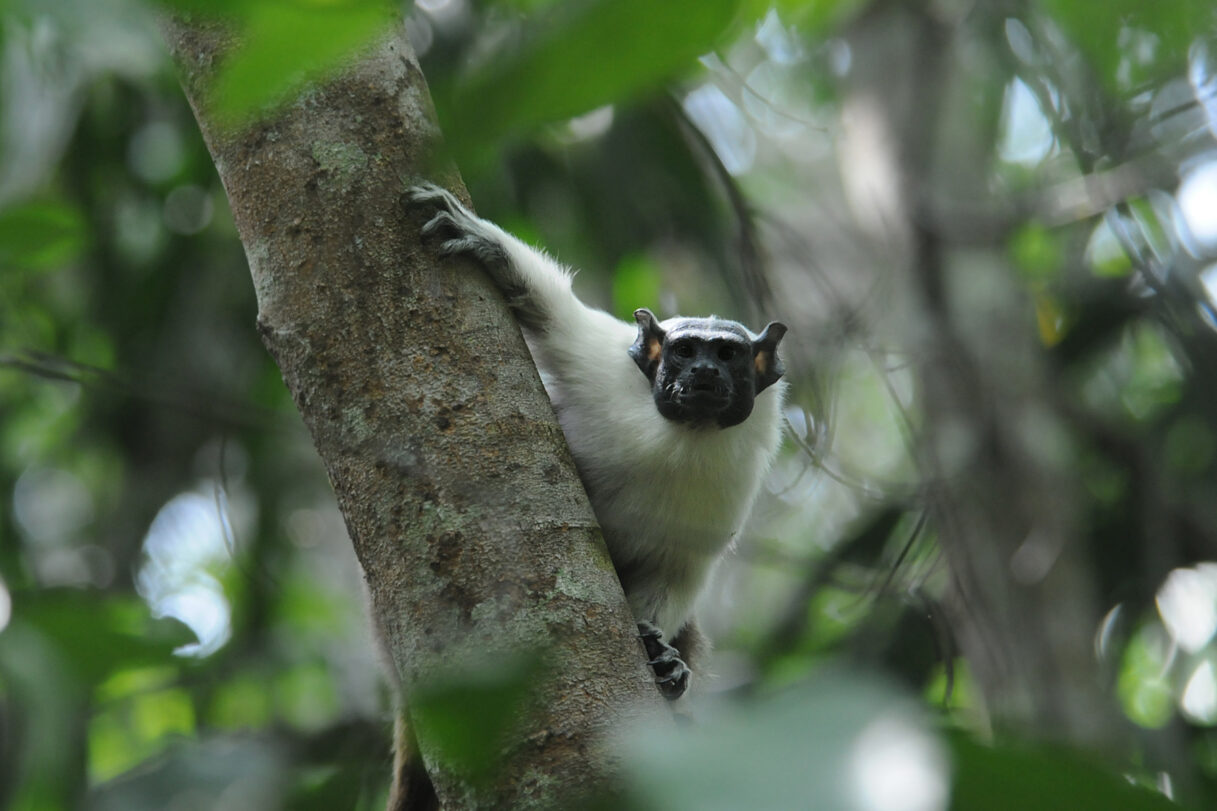
Species extinction risk
This indicator tracks the risk of species extinction over time, providing critical information for planning activities through a species extinction risk score and trend.
Understanding how activities can impact – increase or decrease – the risk of extinction gives us an indicator of the importance of the site or ecosystem where activities are taking place. With more than 46,300 species threatened with extinction according to the IUCN Red List, this is an important measure to ensure there is progress towards halting and reversing nature loss by 2030.
Building an overall picture of the state of nature
Using these four indicators together will give a gauge of the state of nature in a certain location or landscape – providing a minimum, credible set of indicators to understand changes in ecosystem extent, condition and species extinction risk.
These are what we consider ‘Universal Indicators’ to be measured by all users, regardless of their business or operations. Additionally, there are five case-specific indicators triggered in more sensitive ecological or social conditions, such as when a population of a species was healthy but is known to be declining rapidly.
The Nature Positive Initiative is coordinating a pilot programme in 2025 to test whether these terrestrial metrics work in practice for different companies or financial institutions – and will take any learnings to improve the framework. The intention is now to test the practicality of the metrics for users across piloting projects, including within standards and guidance frameworks like the Global Reporting Initiative and the Taskforce for Nature-related Financial Disclosures.
Meanwhile, in view of the UN Ocean Conference in June, the Nature Positive Initiative is in parallel starting to scope out the development of draft state of nature metrics for the marine realm. These will follow a similar pattern to the terrestrial metrics.
Note: It is important to note that these metrics are not yet final and not ready to be applied or used to make claims relating to nature positive – they will first be tested through a piloting programme in 2025 and may change further as a result of that piloting before becoming available for wider use. They should not be used to make claims relating to nature positive.
Sign up to our newsletter
You may
Also like...
-
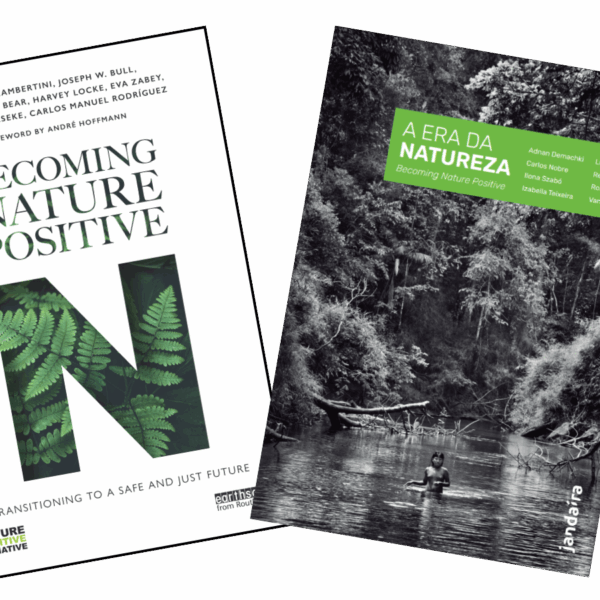
New Brazilian edition of Becoming Nature Positive released at COP30 in Portuguese language
World’s first book about Nature Positive released at the COP30 climate conference in new Portuguese translation
naturepositive.org -
Global nature and sustainable business organizations agree to develop a Nature Measurement Protocol
A group of organizations at the forefront of promoting a sustainable economy have identified the need for a Nature Measurement Protocol, in response to the accelerating biodiversity crisis.
naturepositive.org -

The bioeconomy at COP30: putting people, planet and profit in harmony
COP30 Special Envoy for Bioeconomy Marcelo Behar and Marco Lambertini, Convener of the Nature Positive Initiative discuss what a bioeconomy means for them and how it fits with wider goals including halting and reversing nature loss.
naturepositive.org